No matter how accurate your trained model is, if your model doesn't perform well, or degrades in production it won't be useful for the business. In this article, we share a few techniques to mitigate performance degradation.
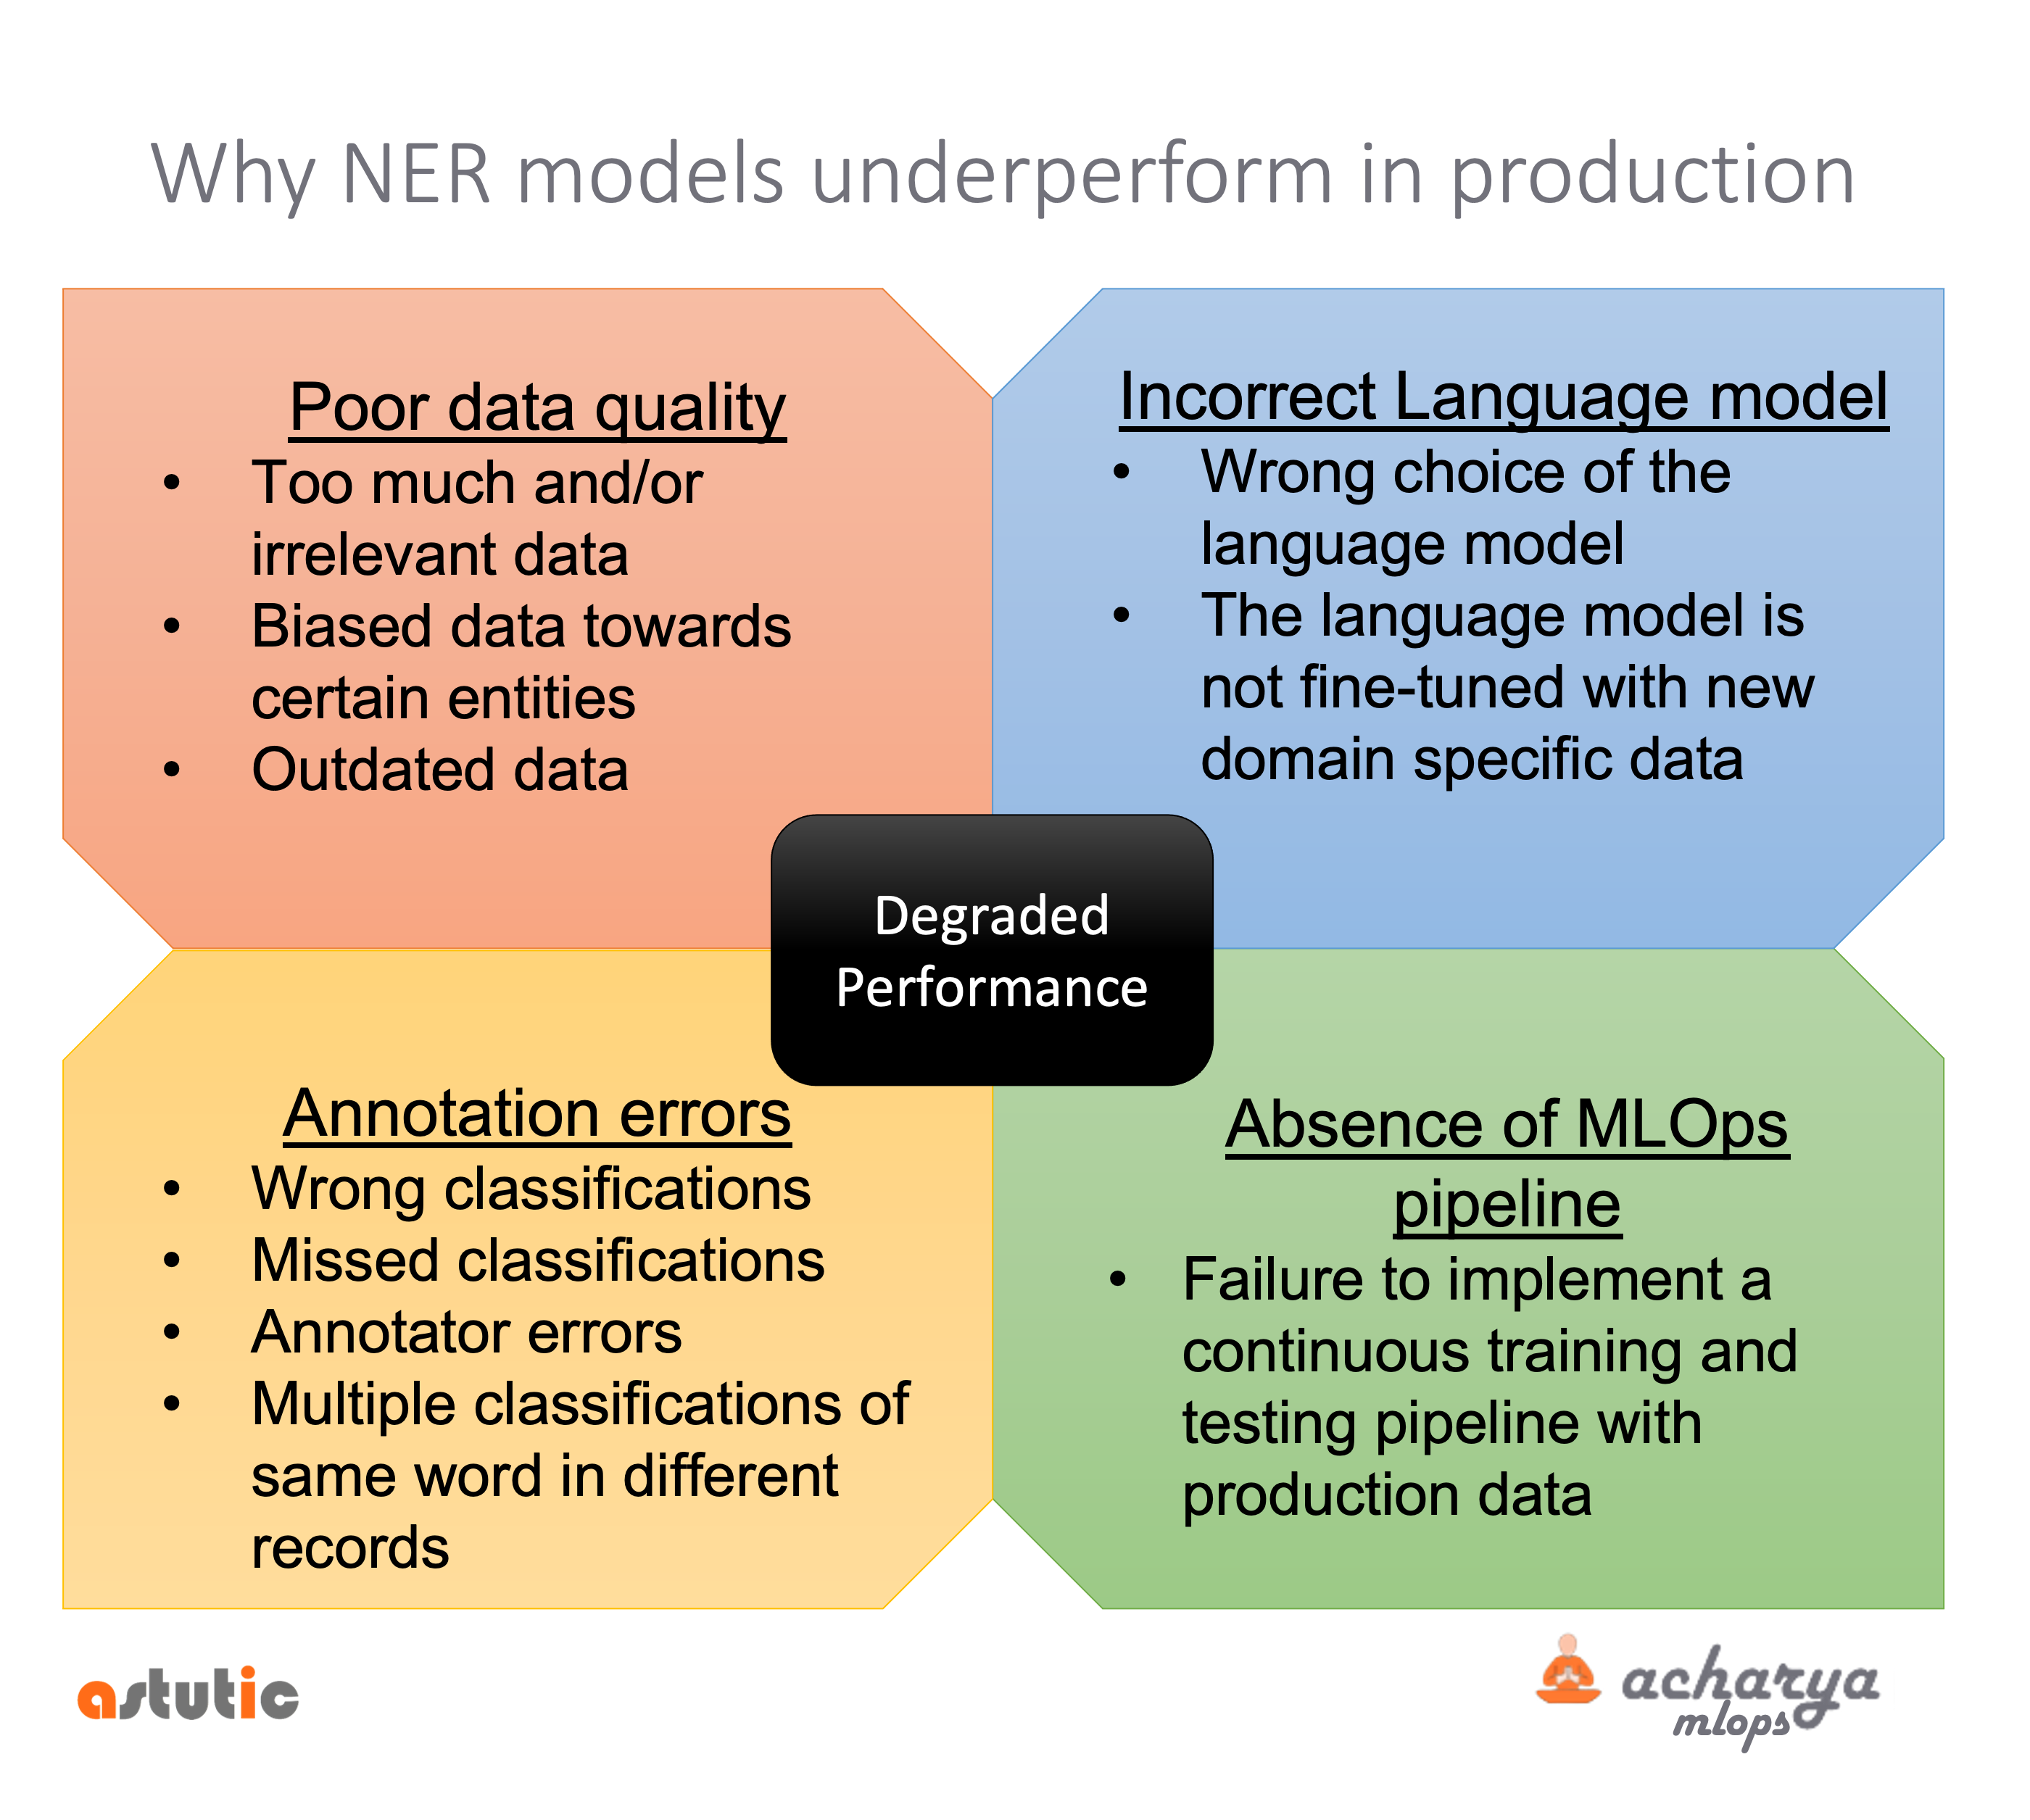
Poor data quality
Good quality data is a known precondition for a good quality model, however, it is observed that in many projects there is a lack of comprehensive data quality analysis. This is partly because there is no standardized approach for data quality analysis, each dataset would need a different approach to determine its quality.
For a NER project, let us look at a few easily fixable issues to better the quality of data and in turn the model performance.
Too much and/or irrelevant data
Almost all NER projects are very data-centric, the idea behind data-centric ai is to train models on good data which is sized appropriately as compared to big data.
As a starting point, a small set of relevant data with good distribution covering the business use case should be curated. This should then be labeled consistently. An off-the-shelf model library (E.g., flair, allennlp, or spaCy) can be used as an experiment to train a model on the dataset. Additional data can then be introduced by studying the training and the model fit.
Feeding too much data can introduce too much noise (due to irrelevant data) as well as labeling inconsistencies in the data. This is one of the key issues we noticed when root-causing for degraded model performance in production.
It is therefore important to curate a bare-minimum amount of data that satisfies the business needs. In the beginning, training on too much data may be counterproductive.
Biased towards certain entities
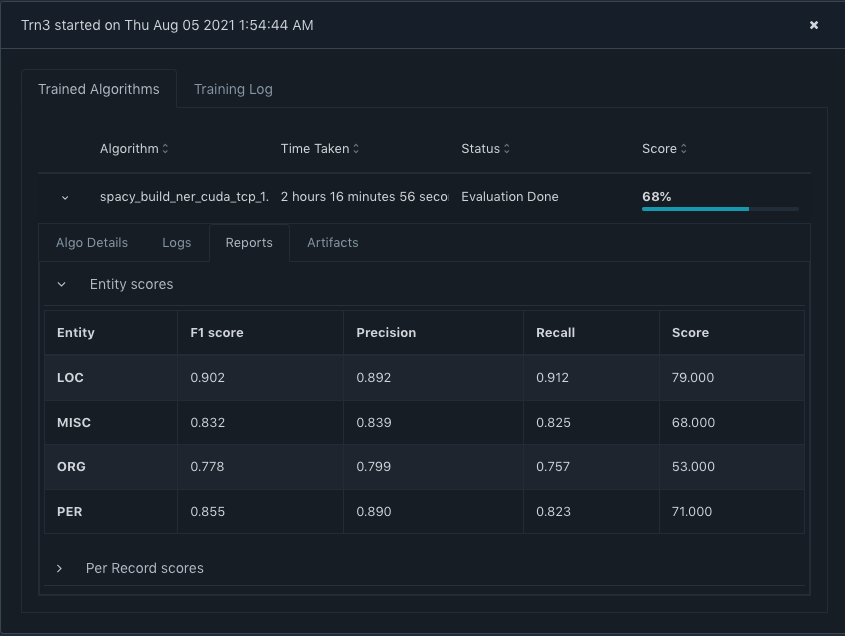
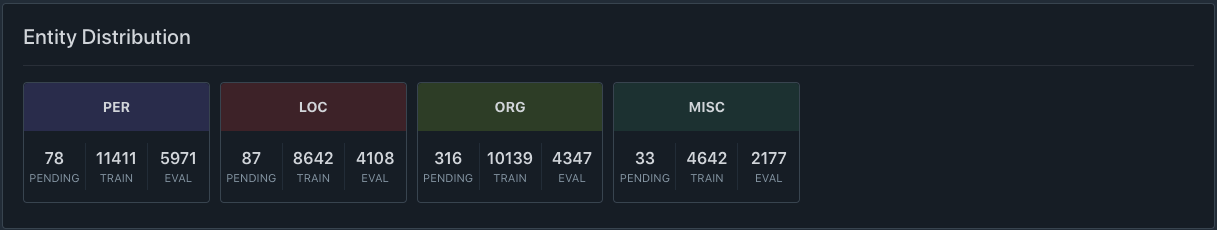
It is very common in a NER project for the dataset to be biased towards certain entities more than others. E.g., we can observe in the Conll2003 dataset that the entities PER and ORG have 11416 and 10153 occurrences in the training data whereas LOC has a comparatively lesser 8643 and MISC only has 4640 occurrences.
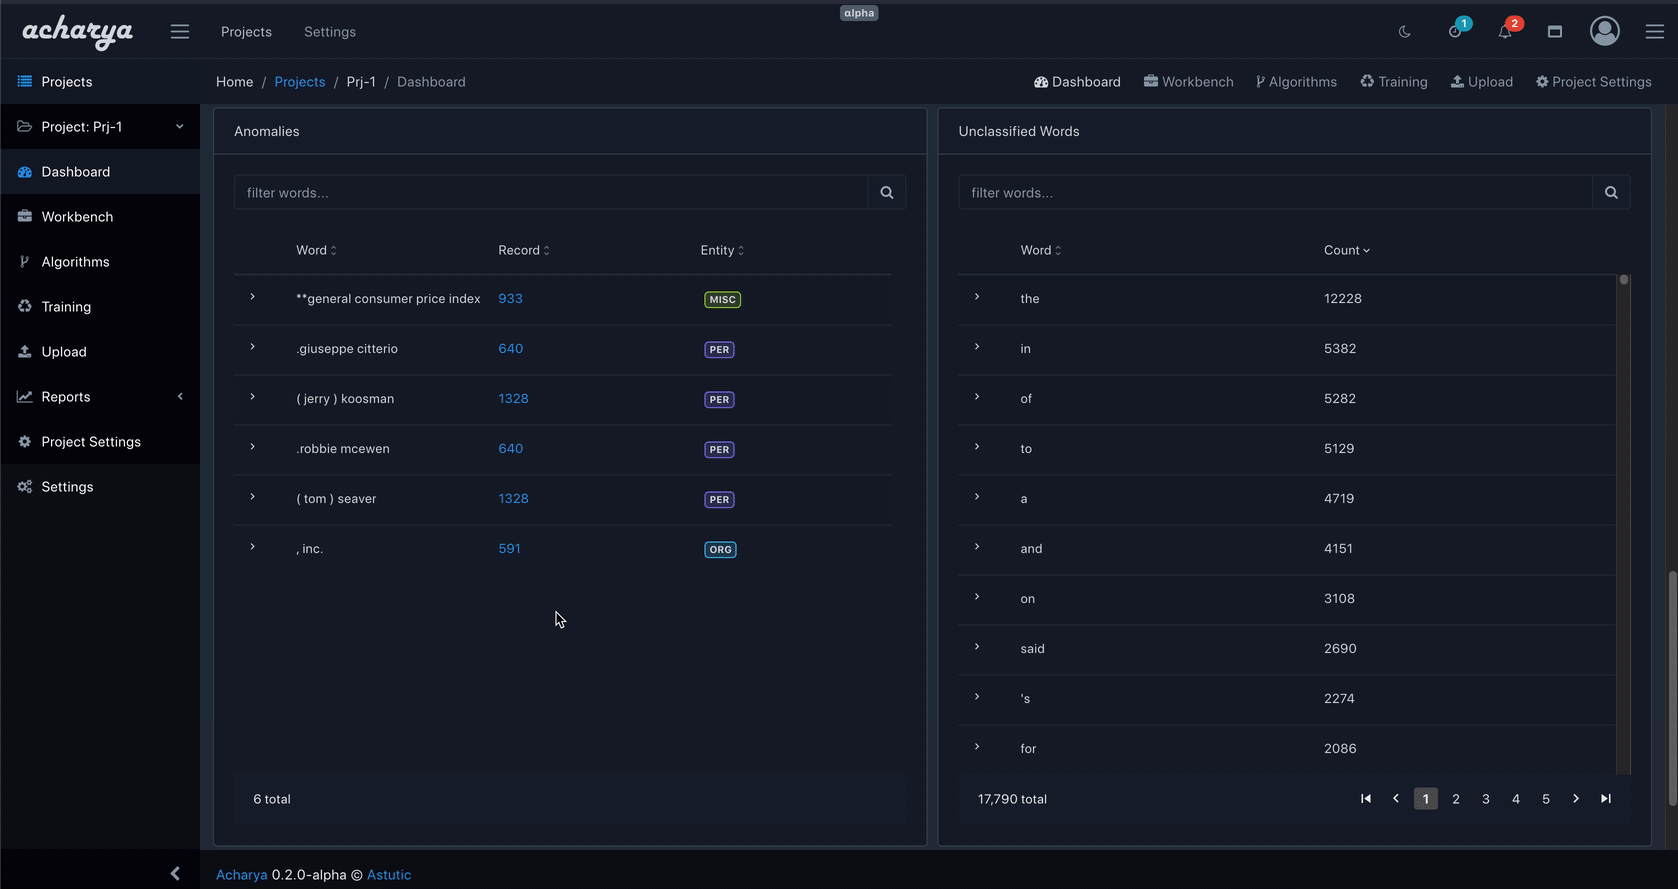
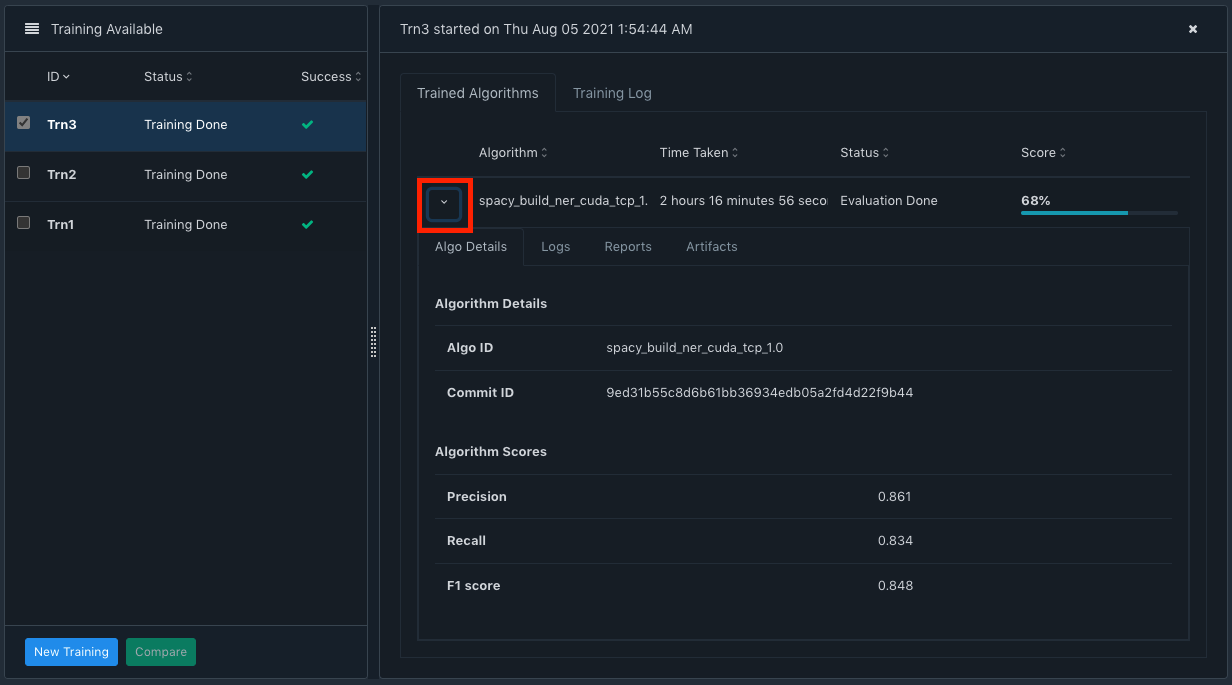
We will be using acharya community edition to analyze the CONLL2003 dataset. Check acharya git repo here. Acharya can import IOB style records and it gives data quality insights about the dataset via its dashboard.
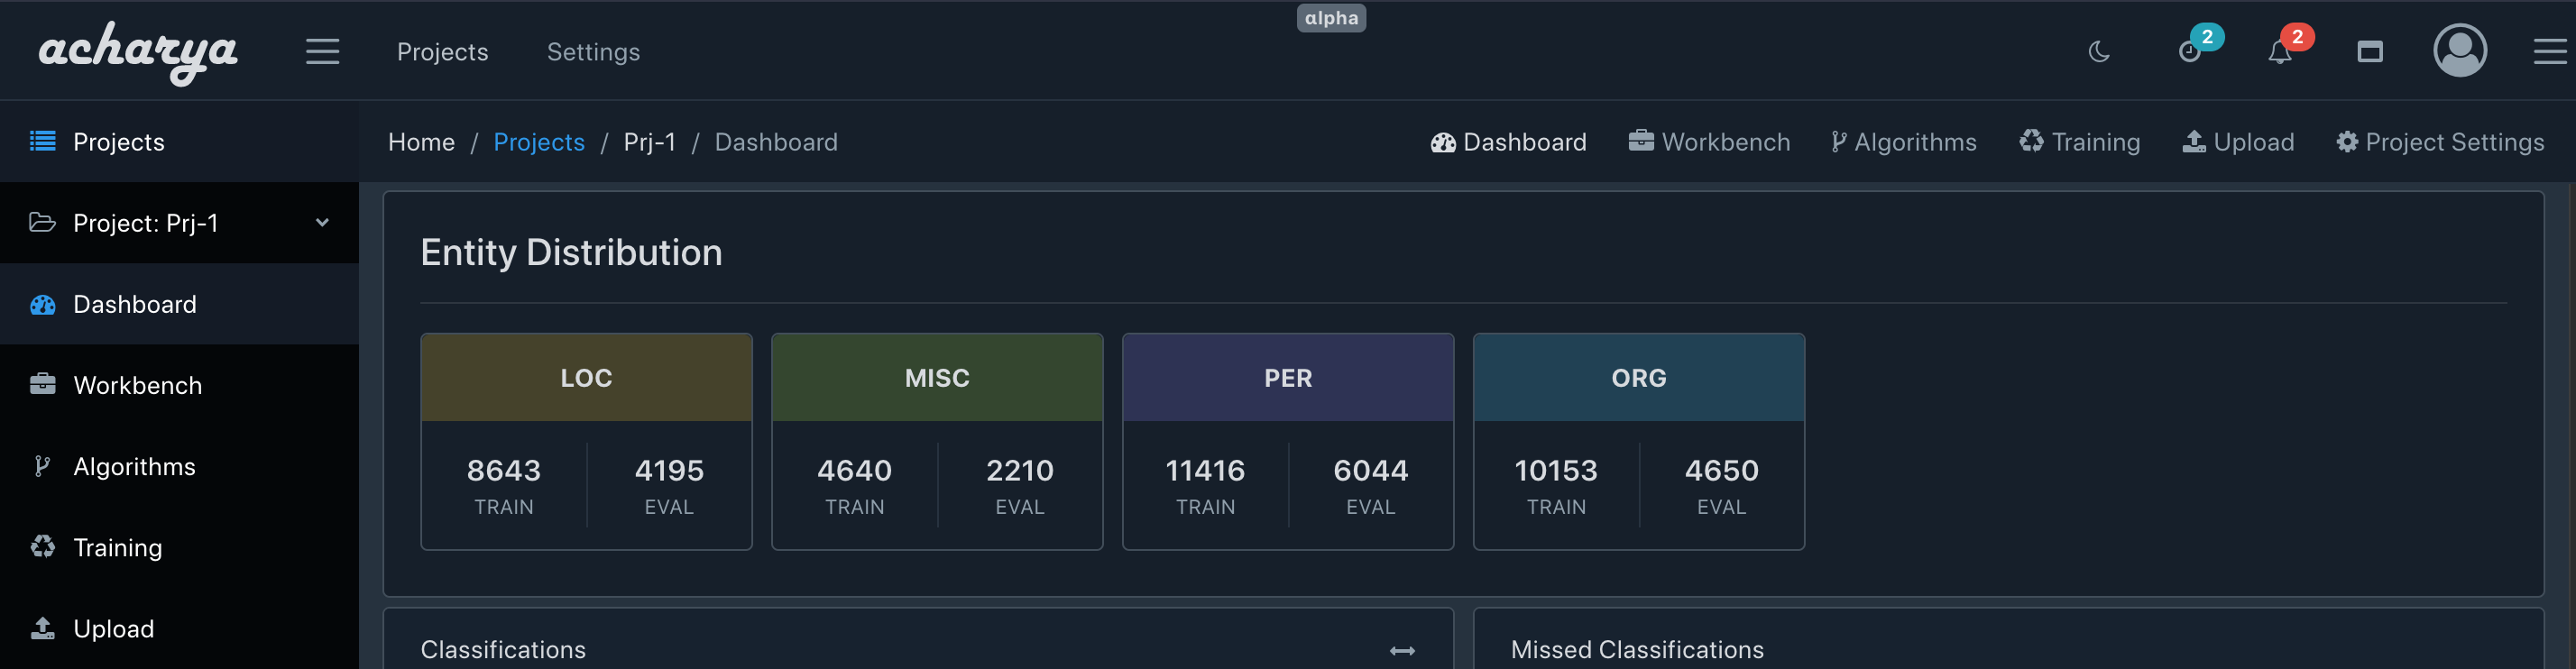
Here we shouldn't be surprised if the trained model demonstrates better performance for PER and ORG as compared to MISC.
Outdated data
When your model has been in production for a while, the underlying data used to train may become outdated. You must plan to introduce new training data periodically. Production data can deviate based on wide-ranging factors - from major world events like a pandemic or a war to a new popular treatment/medicine (in case of clinical NER) or even a new law/regulation; many of these could easily impact the performance of the model. In these cases, the training data will need to be updated to make the model perform on the current trends.
Annotation Errors
Annotation errors are another key reason for a degraded NER performance. Even if you have a well-performing model running in production, it is important to check for annotation errors and fix them in the training and test data. These annotation errors can reveal why the model is underperforming for certain real-world data even though it has scored well in the test/evaluation dataset. The most common annotation errors include:
Wrong Classification
Wrong classifications heavily impact the neural weights of the final model. E.g., In the Conll2003 dataset, we see that the article "The" has been wrongly classified as LOC and in another instance, the word "American" has been wrongly classified as MISC.
We also spot that Wednesday has been classified as ORG but that is a genuine case where the news is reporting about the team "Sheffield Wednesday".
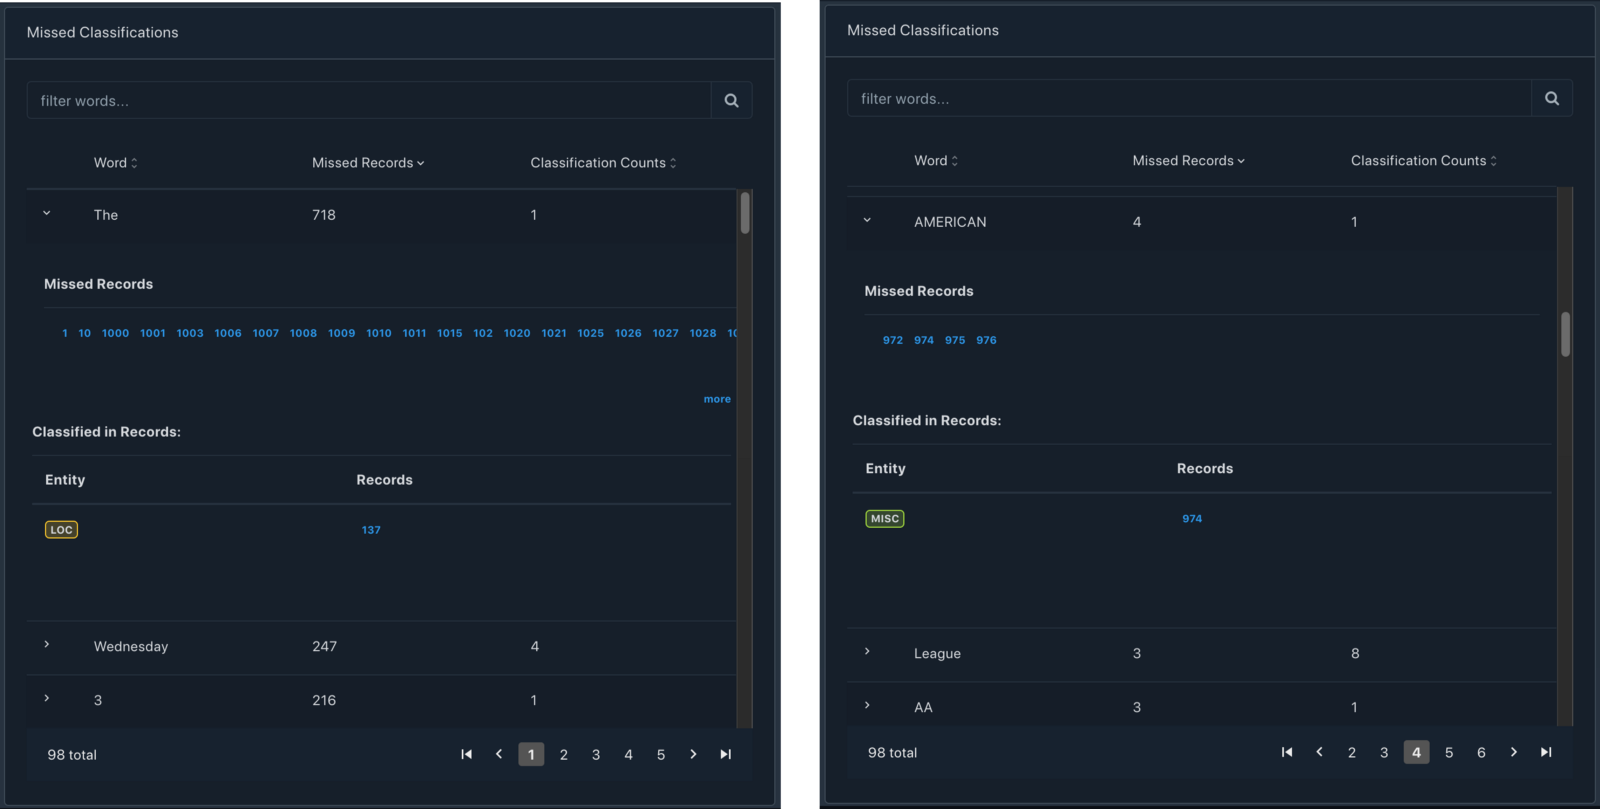
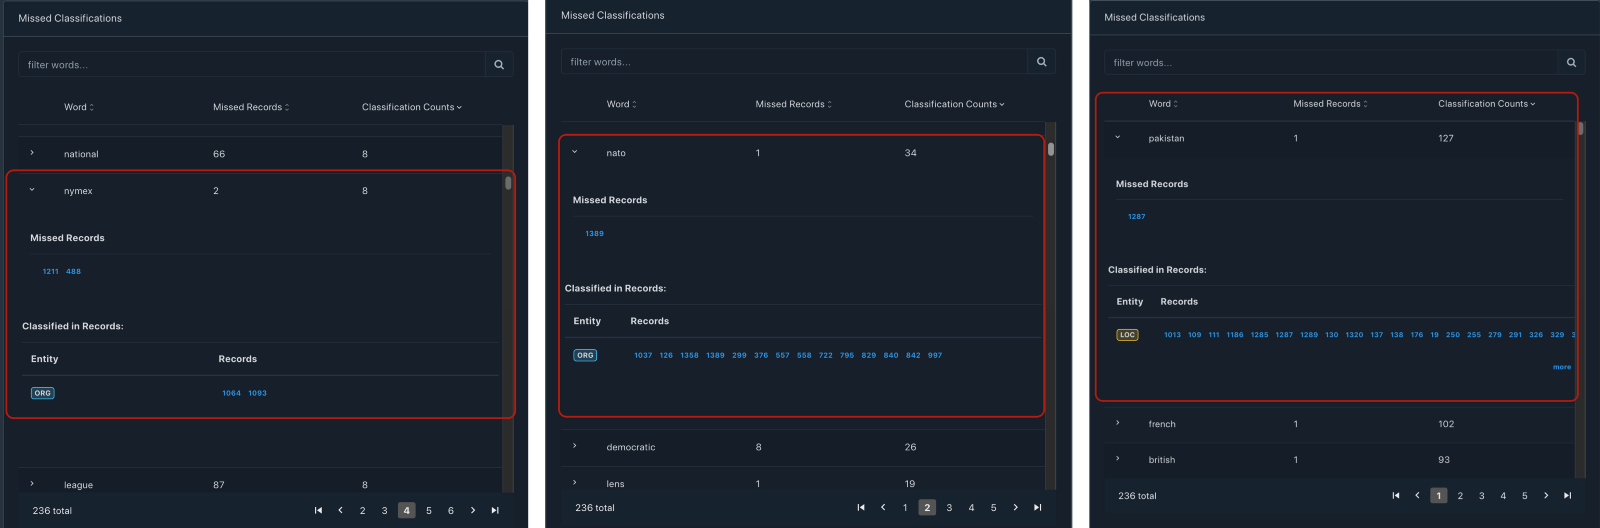
Missed Classifications
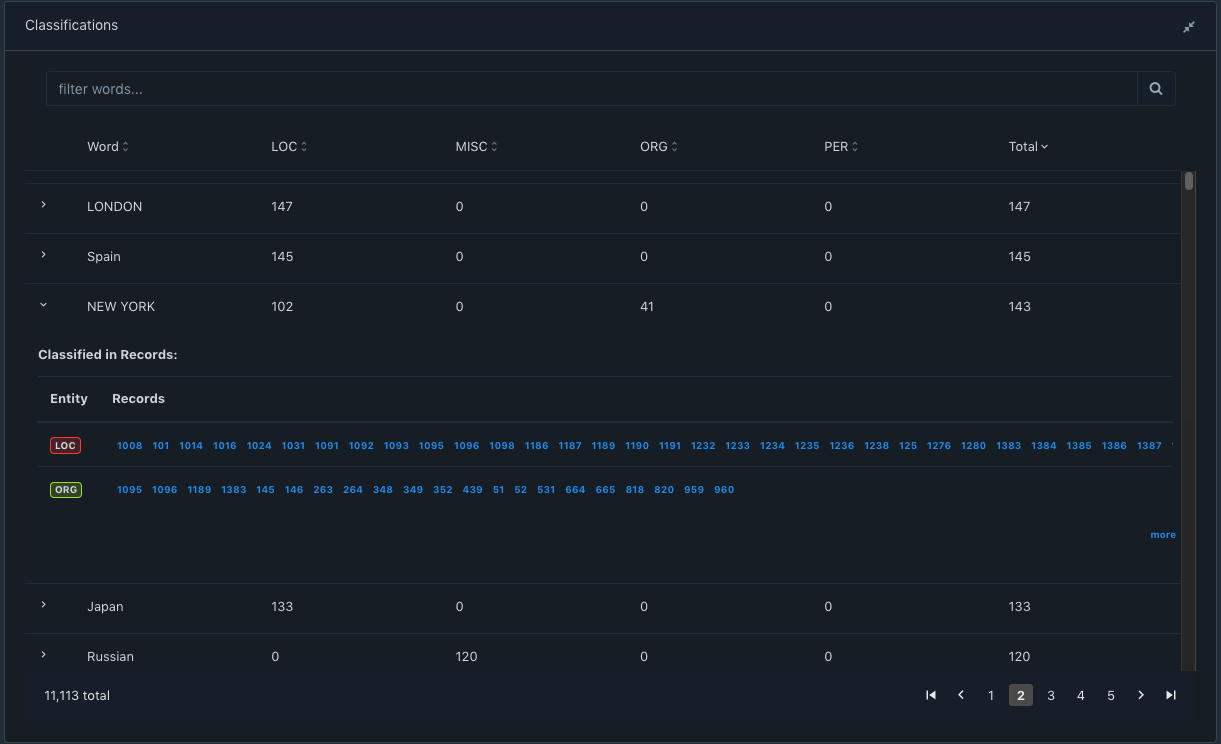
Missed classifications refer to words that have been classified once in the dataset and missed at other locations of the dataset. Missed classifications also impact the neural weights of the model. It is important to identify mistakes where the annotator might have either missed classifying the word or might have wrongly classified that word.
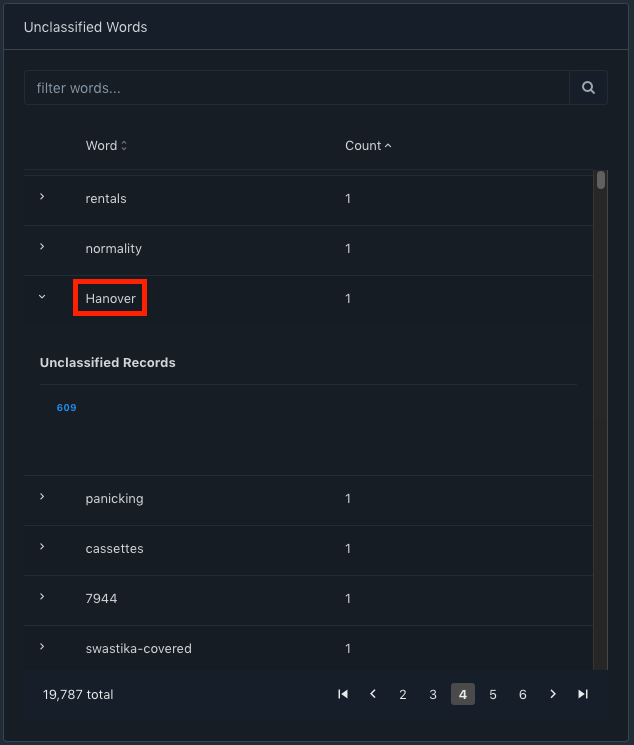
In the case of the Conll2003 dataset, we can see many such missed classifications, to highlight some, we see that "NYMEX" has been classified in 2 records but missed in 2 records. Similarly "Pakistan" has been missed in 1 record and "NATO" in 1 record, which is in the test dataset (impacting the score of a correct model).
Annotator errors
We already discussed missed classification and wrong classification errors which annotators can miss, but when multiple annotators work on the same dataset, it is very important to establish a common understanding between the annotators and have annotation guidelines laid out before they start working. This would result in much more consistent labeling.
Another source of annotator errors is accidental mistakes like mouse select/marking errors. E.g., in the conll2003 dataset, we notice that two annotations of PER entity begin with a "."
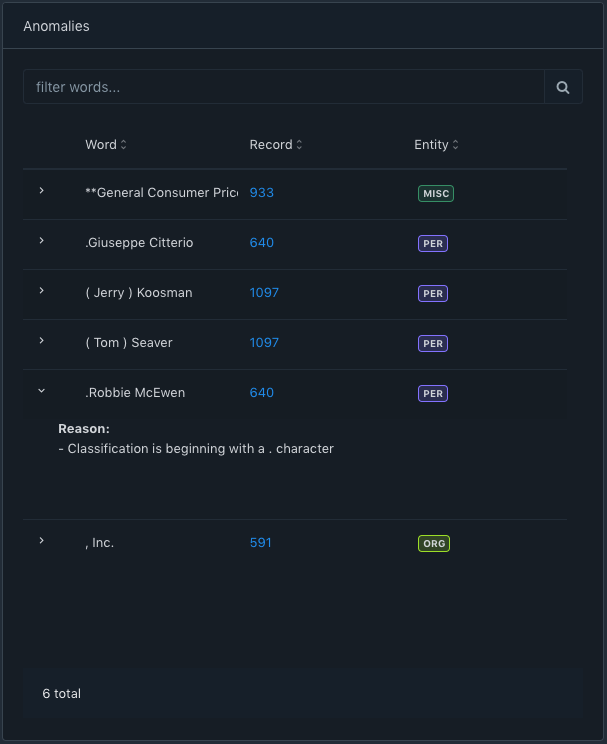
Here we see that "Guiseppe Citterio" and "Robbie McEwen" annotations begin with a "." and this is an annotator error. When we open the record number 640 in acharya we see that the data of the record also needs some editing.
The text is inconsistent for entries 8 and 9 where there is a space between the number and "." and that is probably why the annotator error occurred. The data text needs to be edited to fix the issue. Here the data text is edited in the acharya workbench to fix the "space" issue and the annotation errors are fixed.
Multi classification
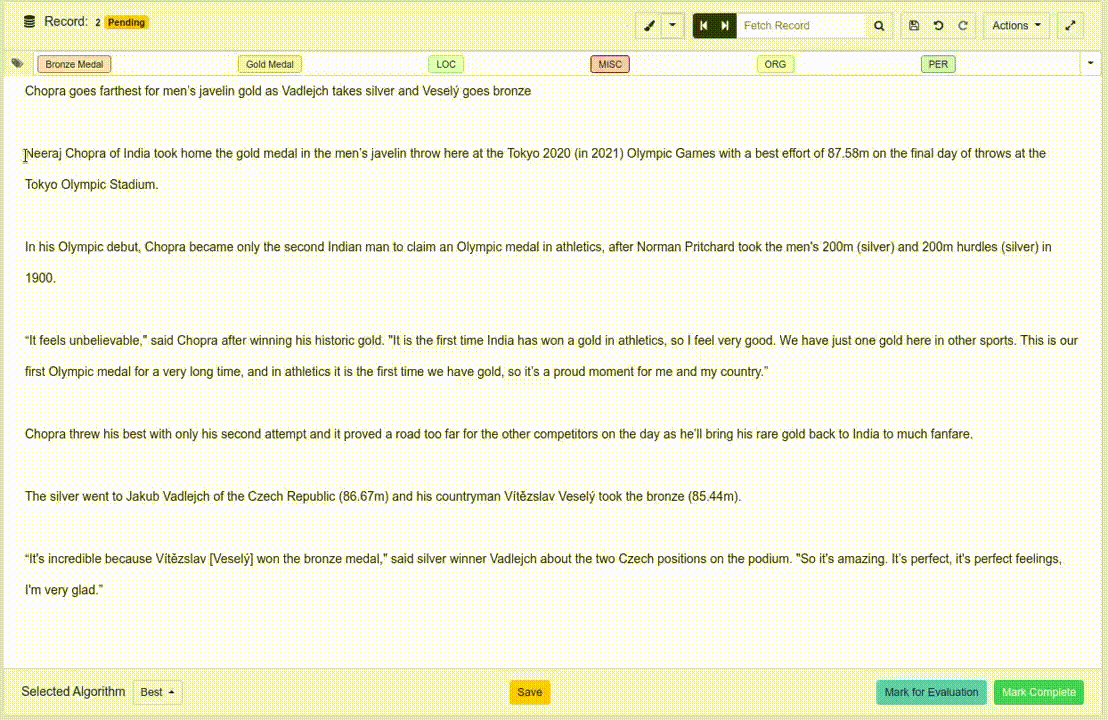
Annotation of the same word in the same context in different places would impact the neural weights in the final model and would impact the model's ability to confidently classify the word when seen in production data. With words like apple or CAD, it is difficult to avoid multi-classification since they depend on the usage context. However, this is a solved problem with today's advanced language models. Yet, multi-classification of the same word with the same context of the appearance does tend to impact model performance. E.g., in the Conll2003 dataset, we see that "China" has been classified as a PER in one occurrence and as a LOC in 149 other occurrences.
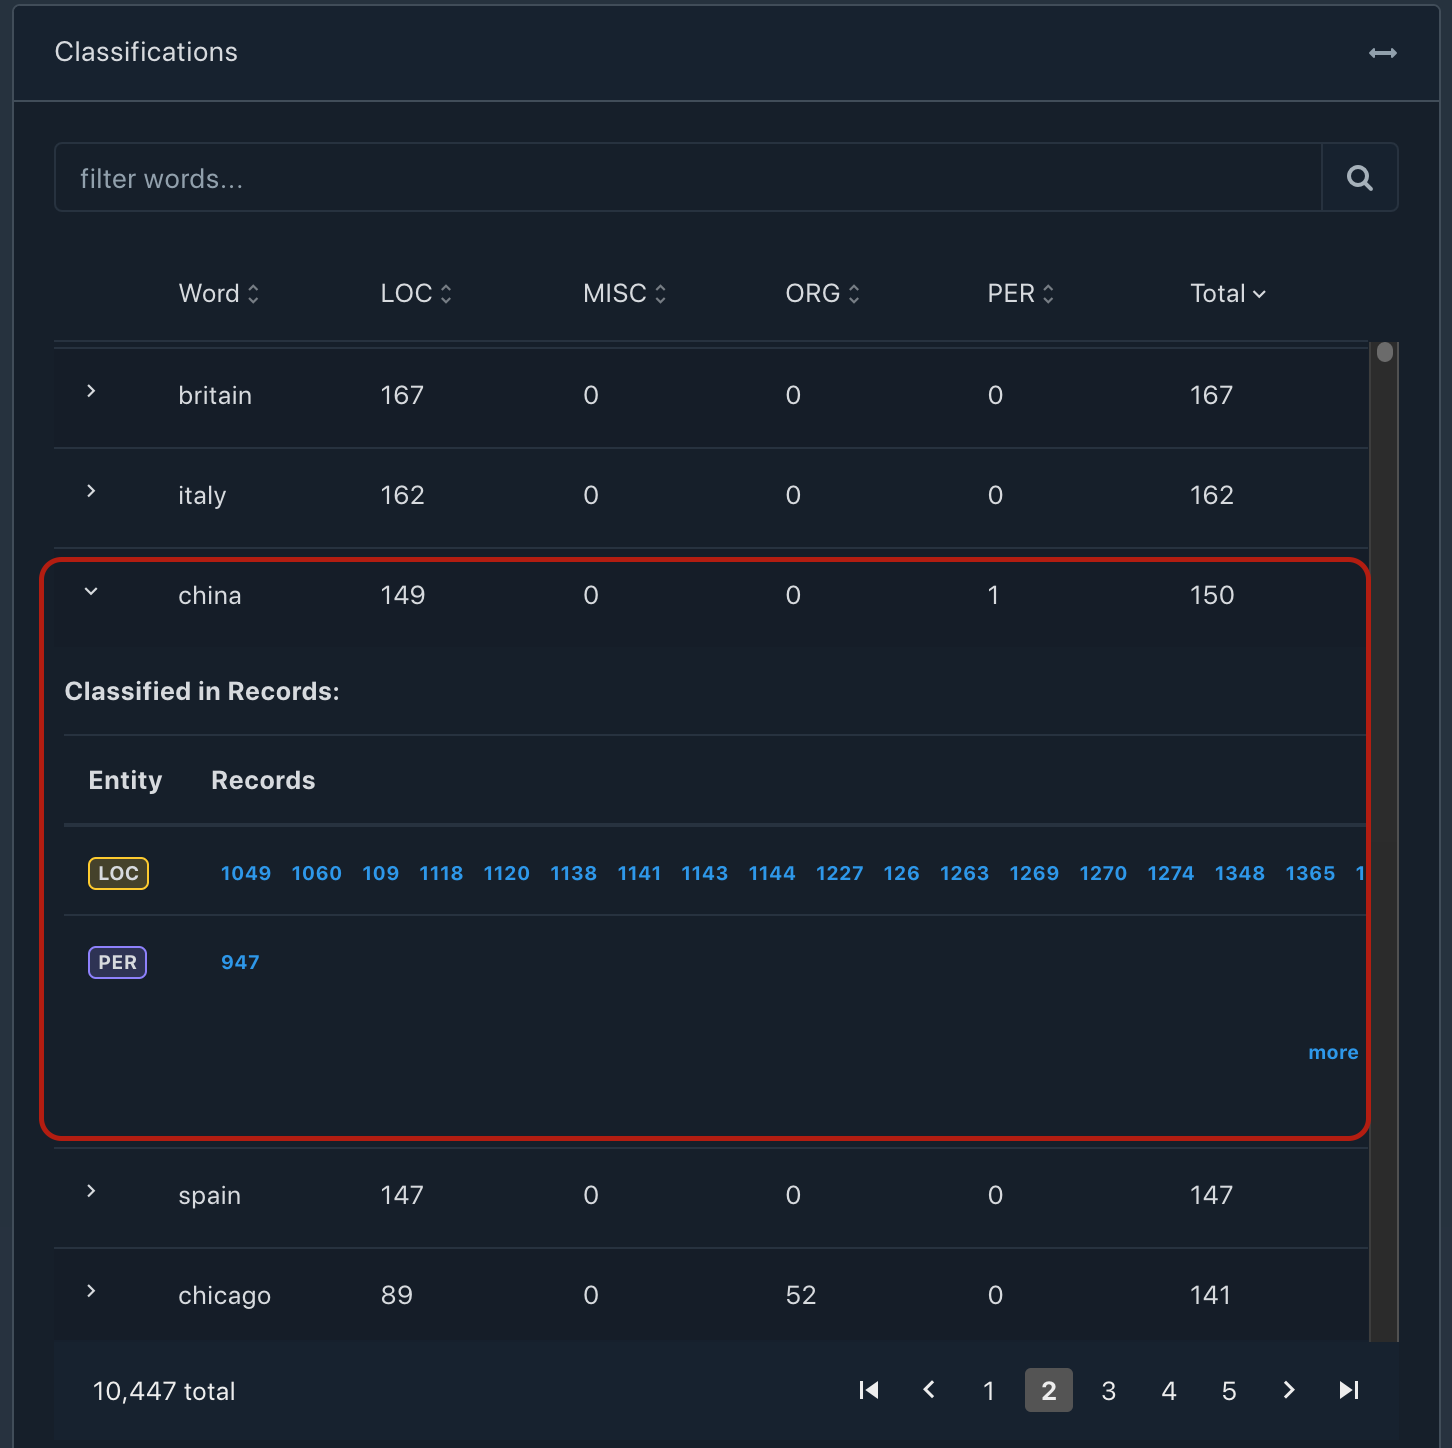
It could be argued that "China" can be indeed the name of the person and the model should be able to handle it, so just to confirm the context of the occurrence of the word "China" we check the actual data.
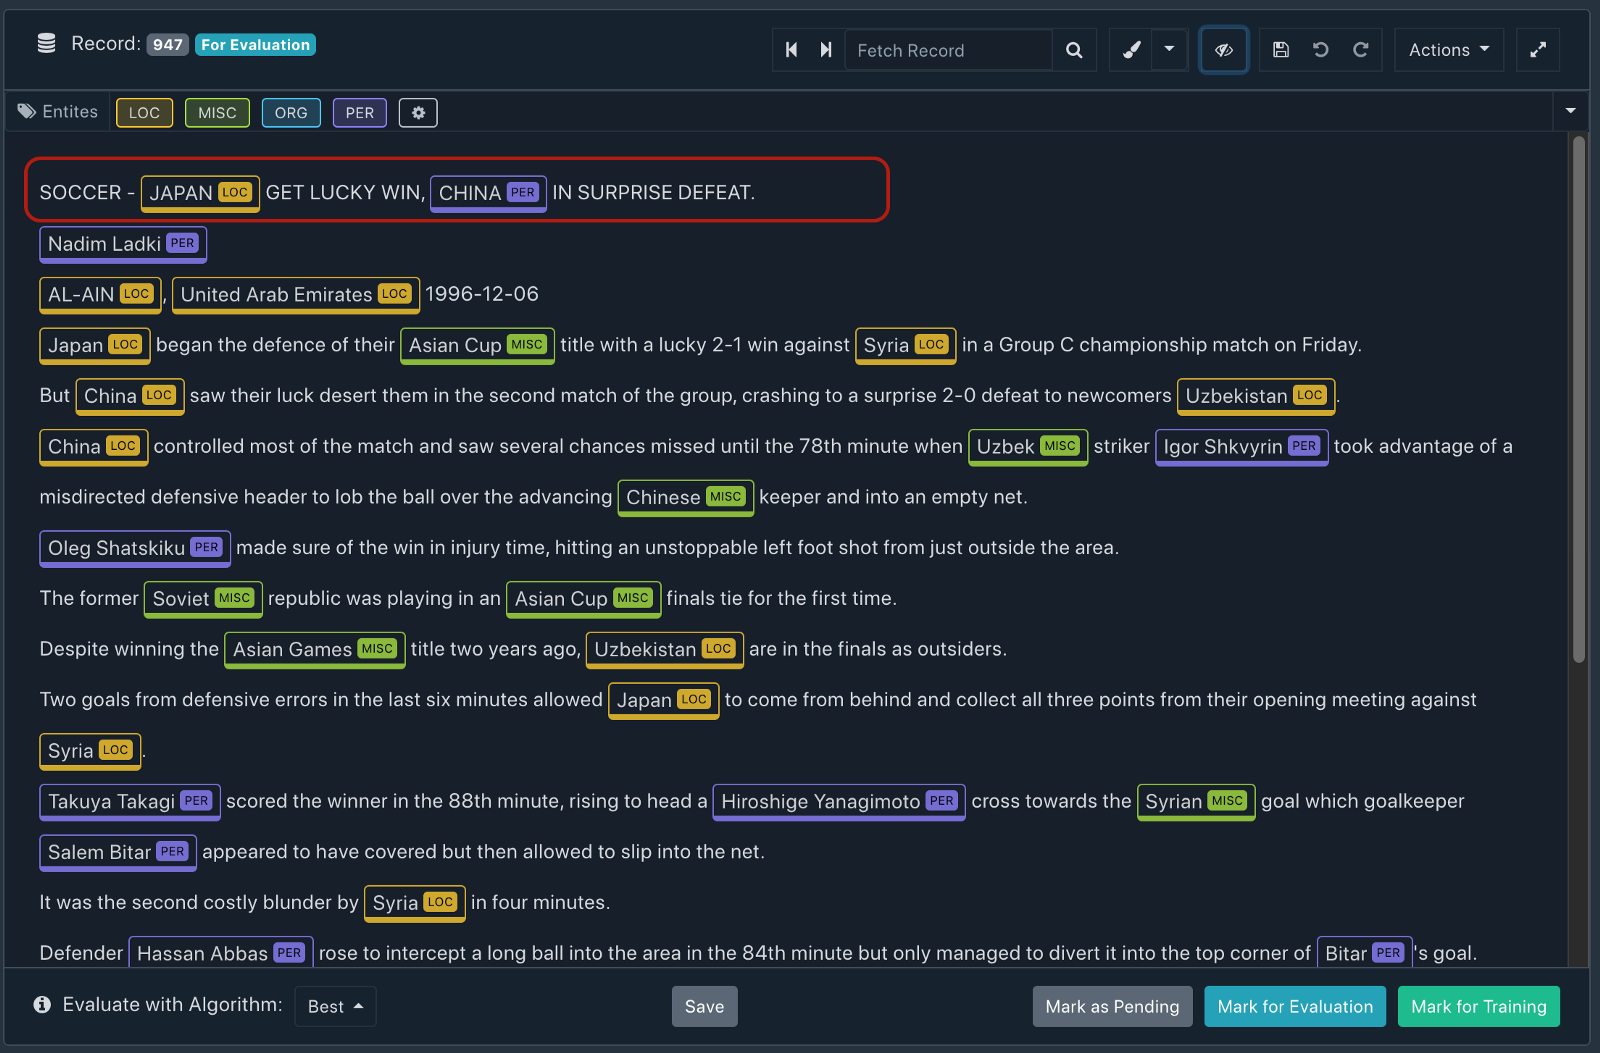
In the first line itself, we see that the article is about soccer news where "Japan" has been correctly marked as "LOC" and the context of the word "China" should be "LOC" instead of a "PER", thus this is a clear annotator error. In the same record, other occurrences of "China" have been correctly labeled as "LOC".
Incomplete language model
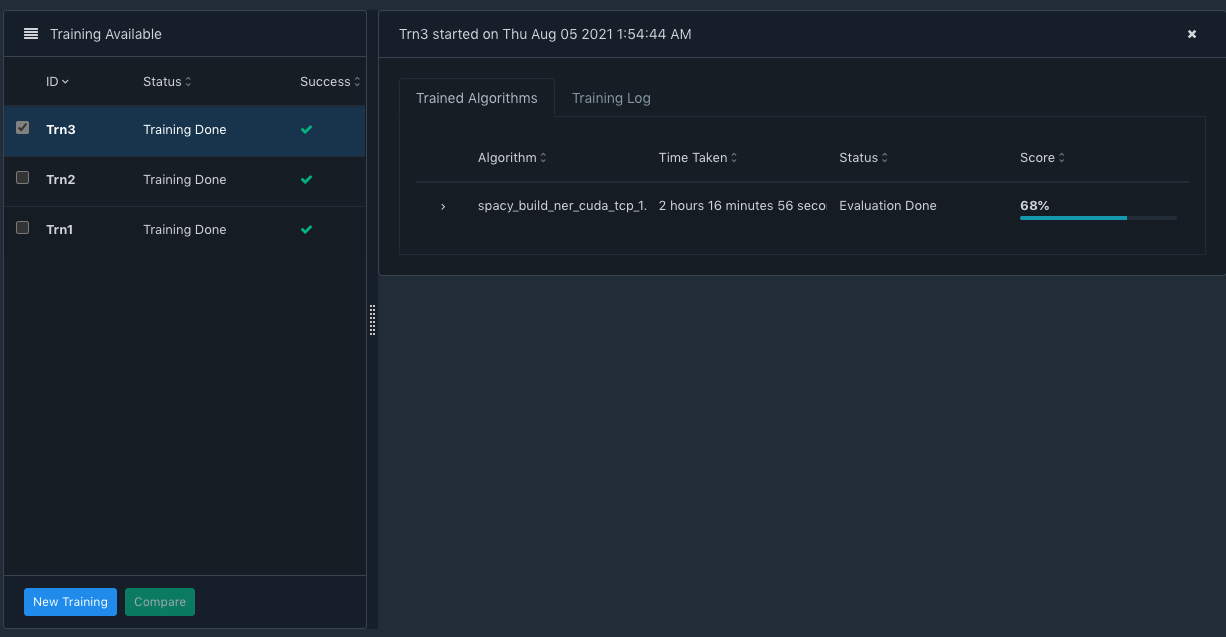
Identifying and choosing the appropriate language model is another important criterion. The latest state-of-the-art language model available might not be suitable for your business needs, often depending on the domain, there could be multiple language models available. Experiments should be run to compare the models on an even slate to determine the apt language model for the use case. E.g., BIOBert and SciBert are similar language models and a maybe a great starting point, however, your specific data might perform better with one than the other.
Often, for a more domain-specific use case, a fine-tuned language model would perform much better than a generic language model. Certain large models are difficult to fine-tune, in such a case, experiments should be performed with older models like Glove, word2vec, or ELMO fine-tuned with your domain-specific data.
Absence of a Data-centric MLOps pipeline
CI/CD stands for Continuous Integration/Continuous Deployment. The terms refer to a software engineering best practice followed by many organizations today. In broad strokes, CI refers to the practice of keeping test code in sync with new code and testing it immediately in an automated manner to identify bugs earlier in the cycle. This often requires the engineering teams to write test cases that exercise their code in conformance with technical and functional requirements (including security, performance, load, etc.). The practice also involves the use of other quality-of-life software/tools to help run the tests as soon as code is committed. CD or Continuous Deployment refers to the practice of deploying the code onto production once all the tests pass to an acceptable level. This enables organizations to get features into the hands of customers earlier.
Likewise, ML models are hardly ship-once and forget. As the data evolves, so should the models. The model should be monitored for real-world performance and newer relevant data should be curated and added to the training dataset. Based on the use case, data received in production can also be de-identified and added to the dataset to complete the learning loop.
This new data may need to be annotated and should be compared with the production model's output to gauge the accuracy of the production model with the new data, helping determine the performance of the model in production.
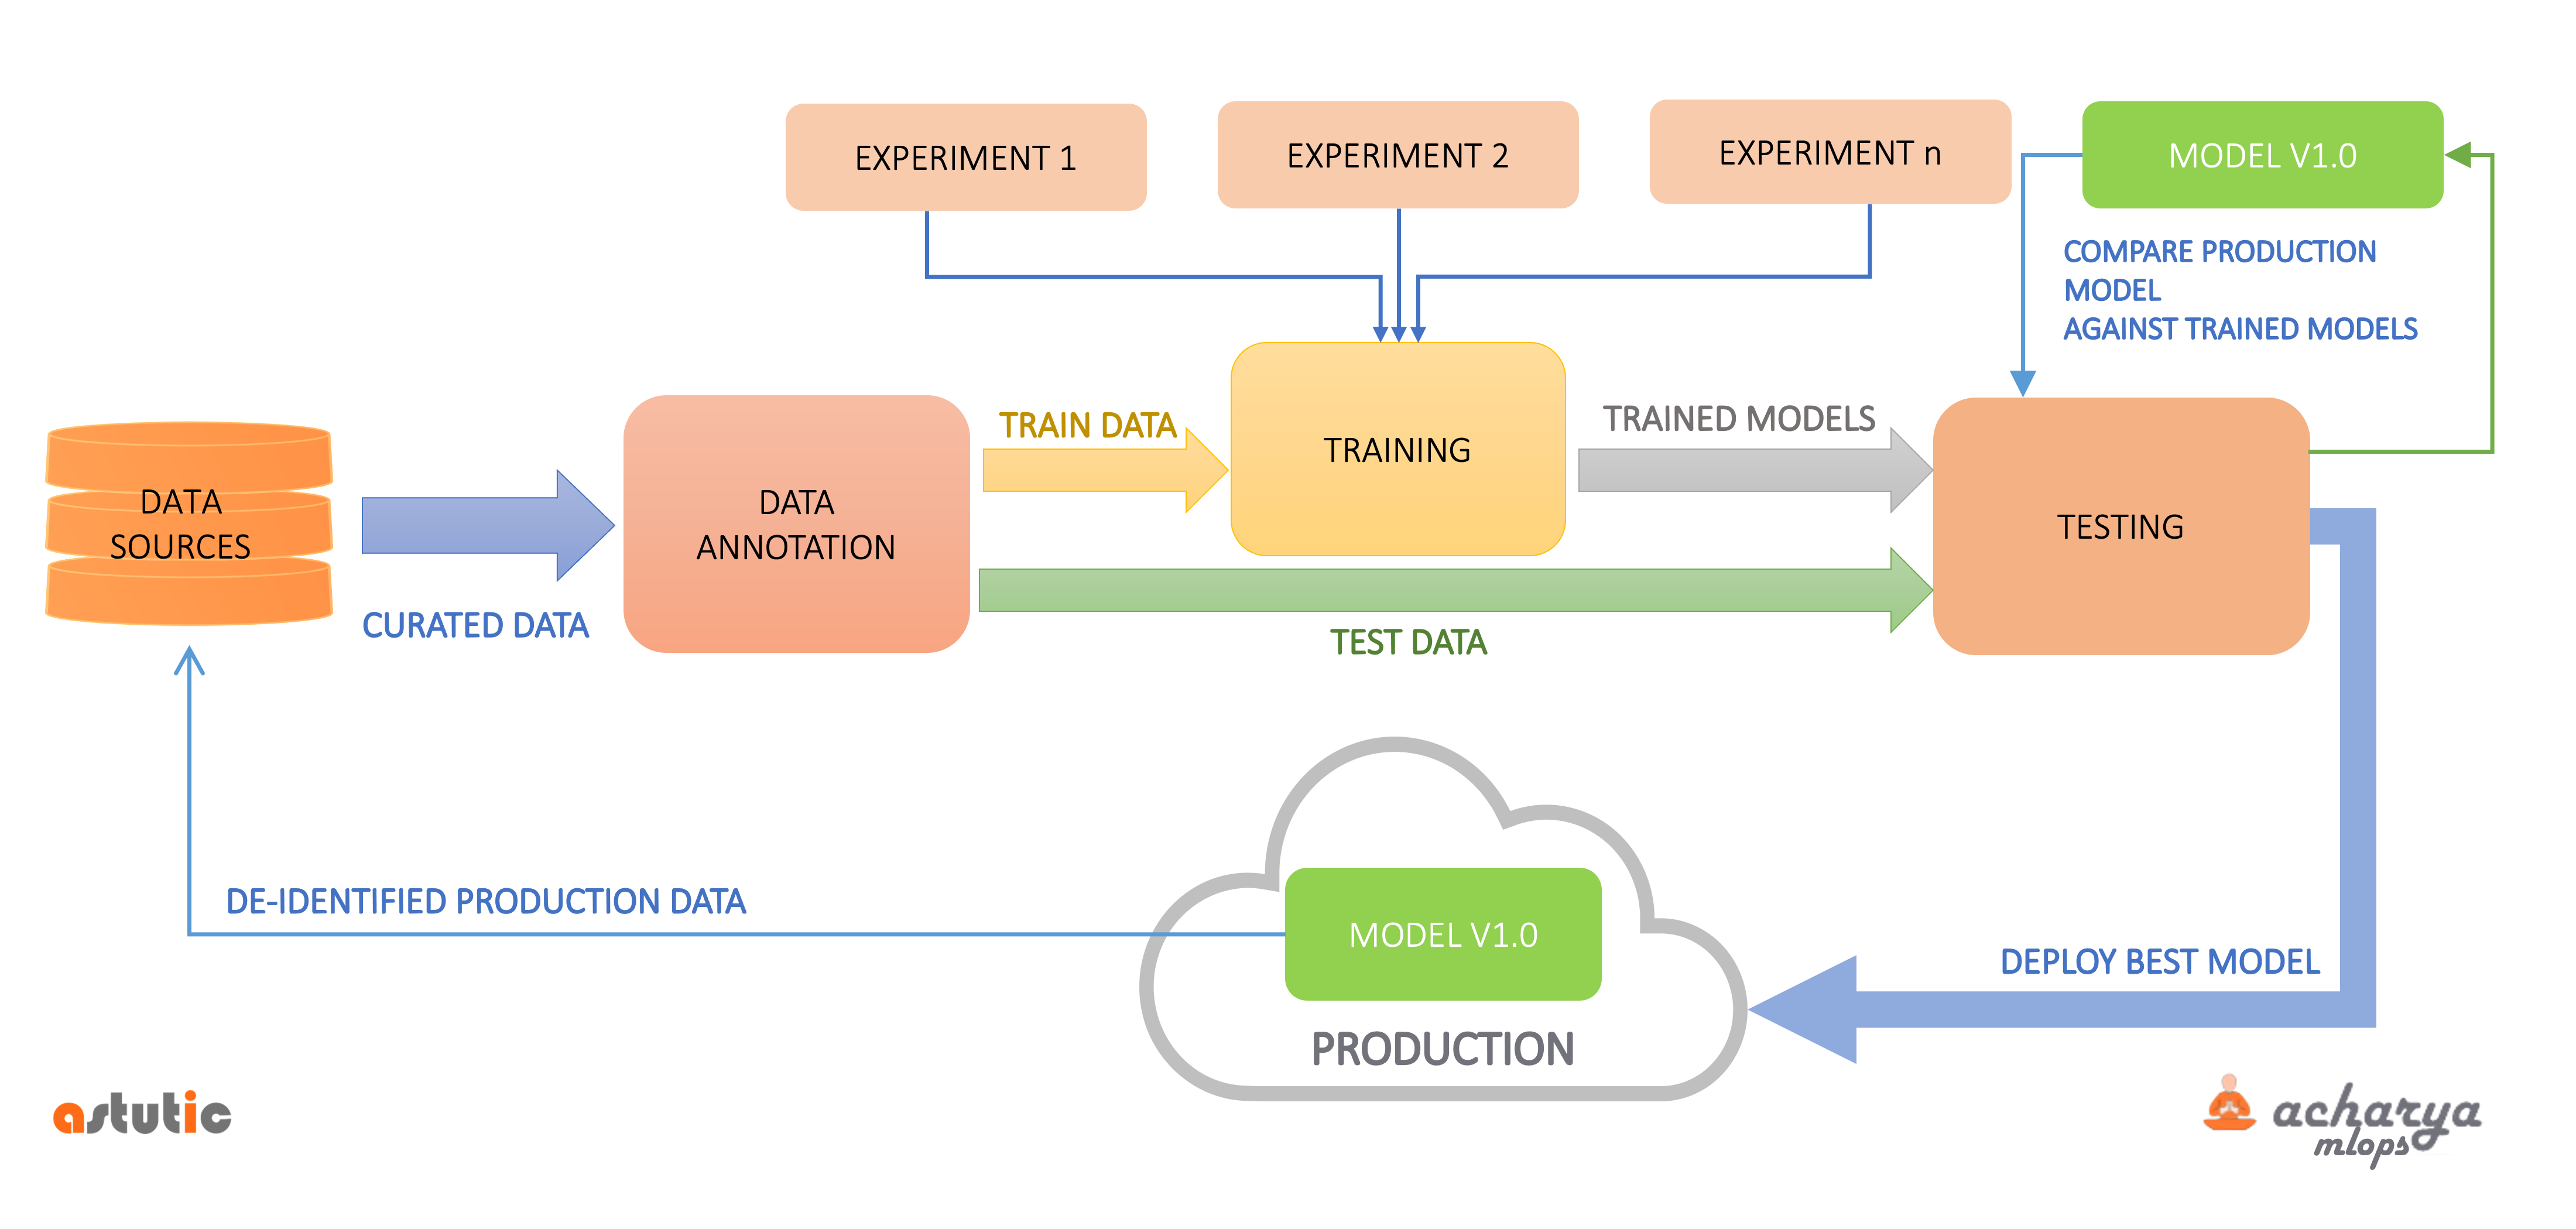
This is depicted in the simplified schematic above. The central part of the flow is curated data from all the enterprise data sources getting annotated and this annotated data getting used for training and testing of models. The notion of an experiment refers to a combination of algorithms, language models, and their respective hyperparameters. The key insight here is that all the experiments, including the model currently in production, are being evaluated/scored with updated data from production. Such a process helps teams identify the best-suited model for production.
Continuous training and continuous testing should be established as a pipeline.
Summing up
In our conversations with many teams, we have found that the points mentioned above have brought about significant improvement in model performance. Bringing in software engineering best practices benefits data science teams too. A well-setup MLOps pipeline not only frees the team from integration hassles with engineering and increases flexibility, but it also brings the ability to track what went wrong when there is a drop in performance with a point-in-time snapshot of data.
As more and more Data science teams adopt innovative practices, there is a need to share what works best in the community to take the practice forward. We look forward to hearing from you about your best practices.
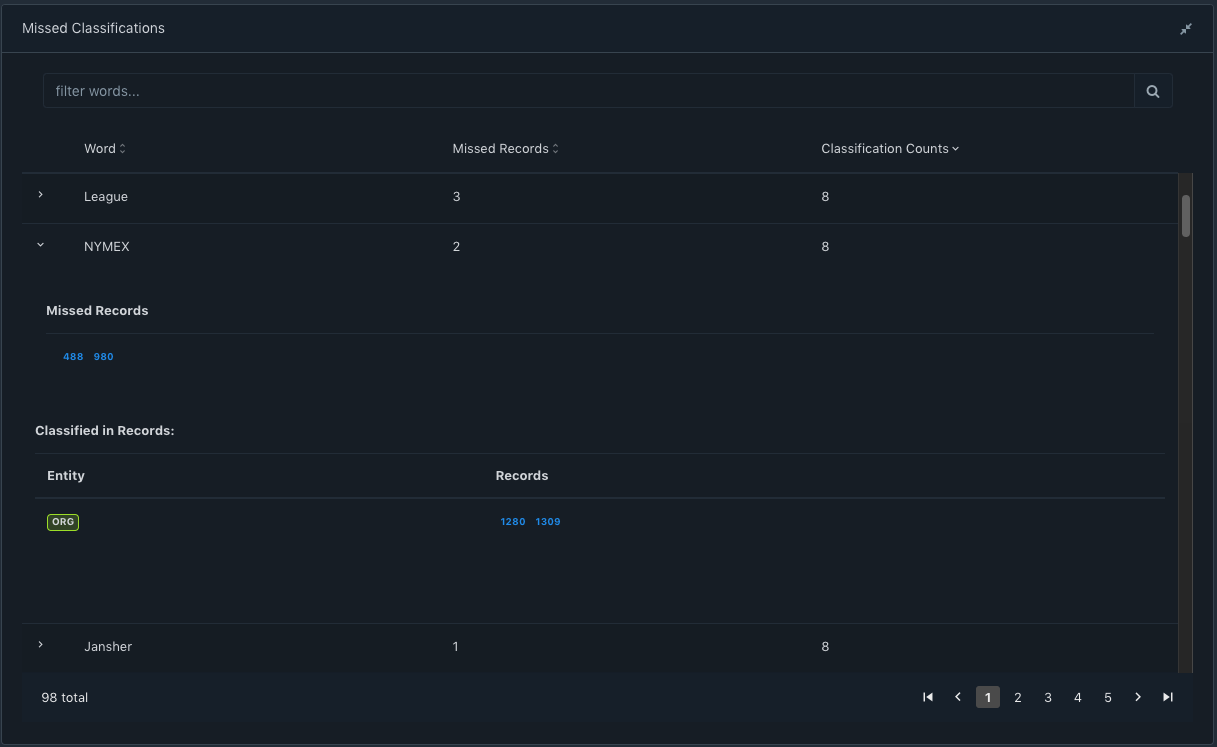 Sorting on Missed Records would let the user know annotations which might have been missed by the annotator And sorting on Classification Counts would let the user know annotations that might have been wrongly annotated by the annotator.